


Sellers can access detailed reports from their Seller Dashboard, where they can view clear information about their products, sales performance, and overall store analytics. The Reports section in the AladdinStores Seller Dashboard allows sellers to track performance, analyse sales data, and understand how their store is performing over time. This section is essential for making informed business decisions based on real data.
The Reports section in your Seller Dashboard helps you understand how your store is performing at a glance. It brings together key information about your products, sales, orders, and earnings in one easy-to-read place.
Using Reports, you can see how your products are selling, track your sales over time, and review your earnings. The charts and tables make it simple to spot trends, understand customer activity, and monitor your store’s progress without needing any technical knowledge.
The Reports section in your Seller Dashboard gives you a clear overview of how your store is performing. It helps you track your products, sales, orders, and earnings in one place, so you can understand what is working well and what needs improvement.
Using the Reports section, you can see detailed information about your products, such as how many items you have sold, which products or variations perform best, and how different categories contribute to your sales. This allows you to focus on popular products, improve low-performing ones, and plan future listings more effectively.
The Reports section also provides sales and revenue insights, including gross sales, net sales, returns, discounts, shipping, and taxes. With clear summaries, charts, and tables, you can easily track your sales over time, compare different date ranges, and understand how your pricing or promotions affect your earnings.
You can use the Orders reports to review order activity and customer purchasing behaviour, such as total orders, average order value, and number of items per order. This helps you make better decisions about pricing, bundles, and special offers.
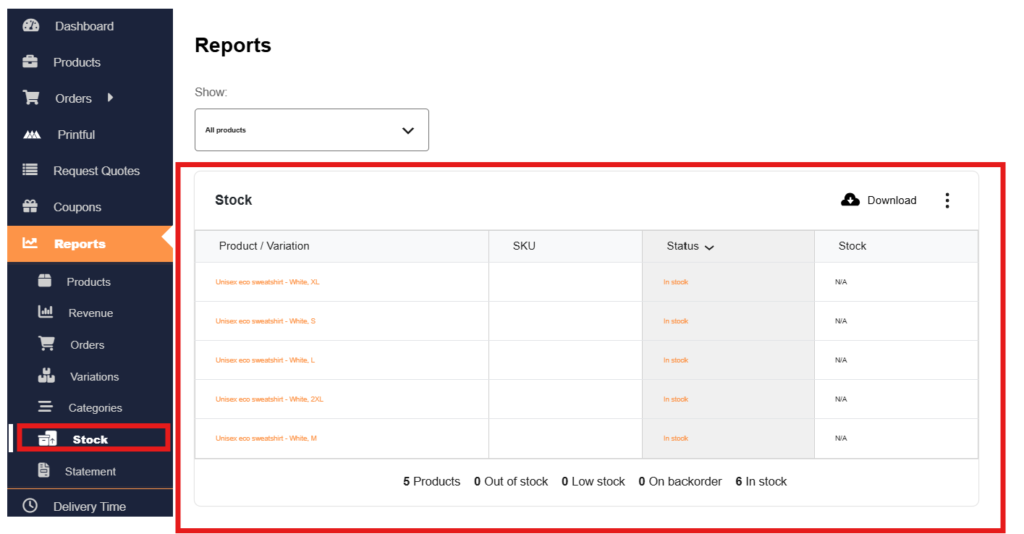
The Stock and Variations reports support better inventory management by showing stock status and performance of different product variations. This helps you avoid running out of popular items and manage your inventory more efficiently.
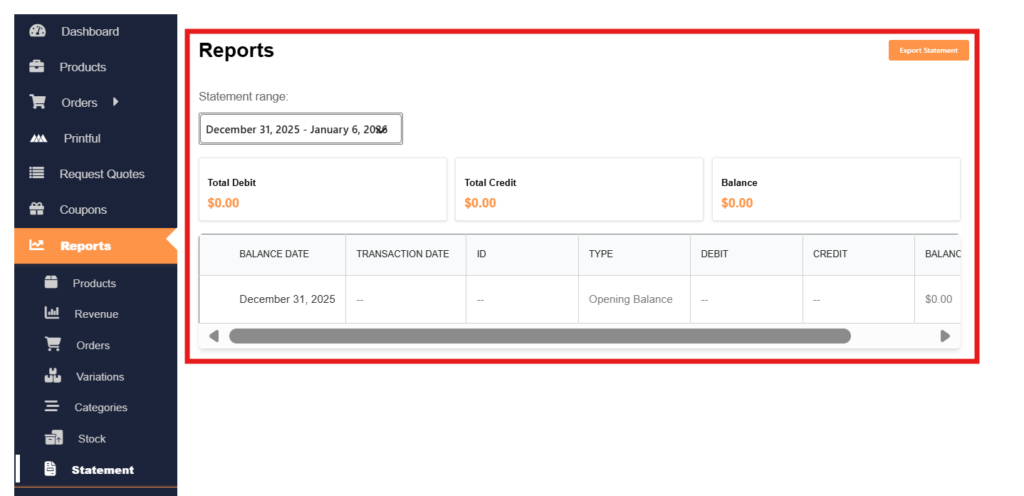
Finally, the Statement report gives you a clear financial summary, showing your balance, credits, and debits. This section is especially useful for tracking earnings, reviewing transactions, and preparing for withdrawals.
Overall, the Reports section helps you:
This section is designed to help you make better decisions for your business. You can use it to identify best-selling products, plan stock more effectively, review order activity, and keep track of your financial performance.
Before using the Reports section, simply remember:
By checking the Reports section regularly, you can manage your store more effectively and grow your business on AladdinStores.
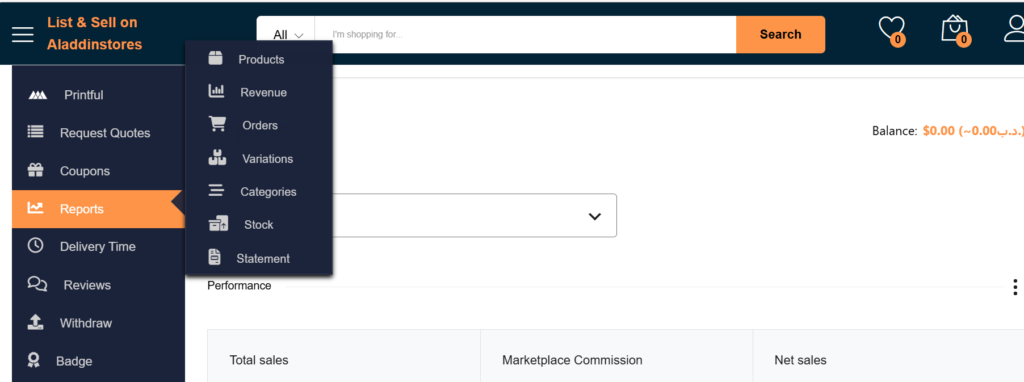
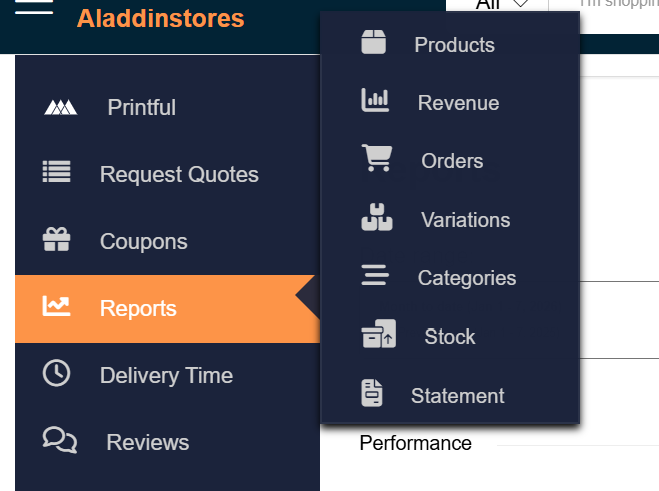
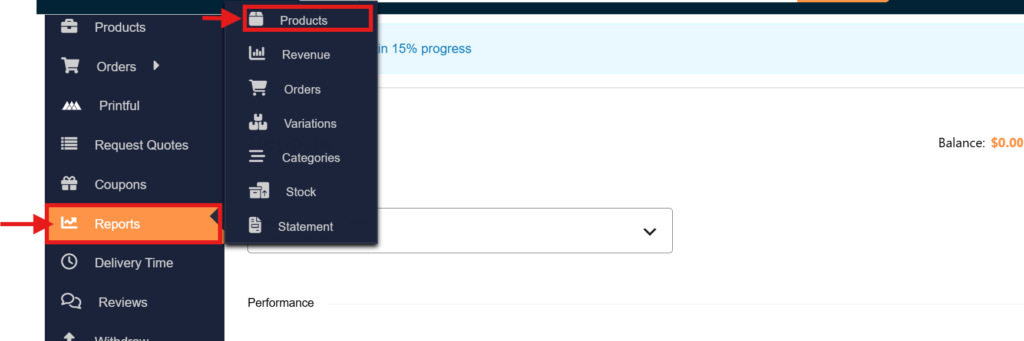
How to Access Reports
Each report provides a different insight into your store’s activity.
2️- Reports Main Layout (Applies to All Reports)
Every report page has the same structure:
If you see “No data for the selected date range”, it simply means there are no sales yet — this is normal for new stores.
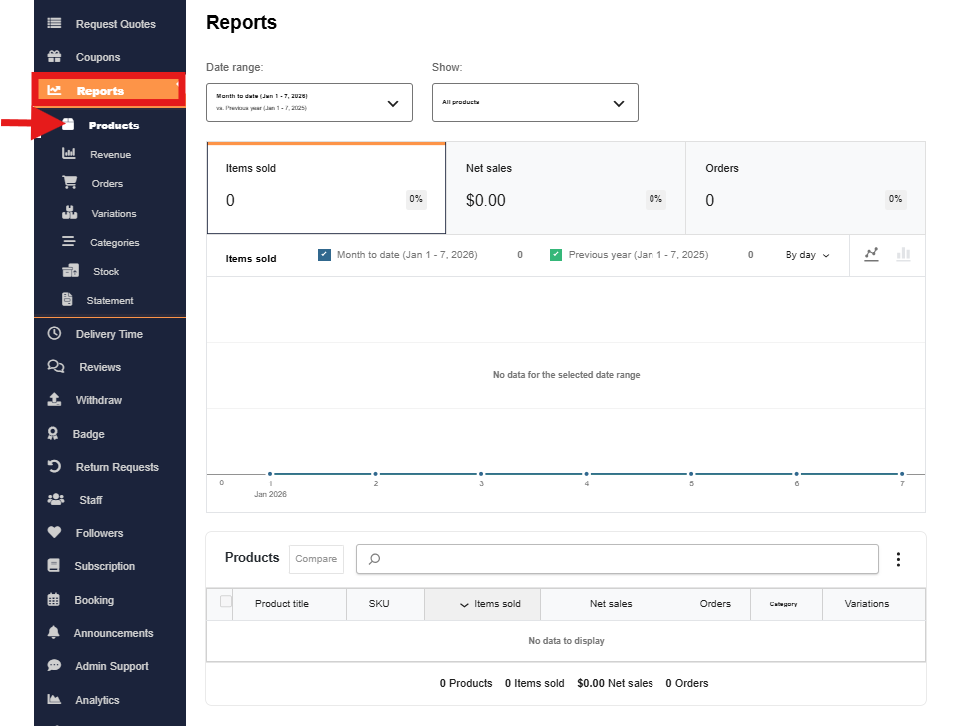
3️- Products Report
Path:
Reports → Products
What it shows:
Table includes:
Why it’s useful:
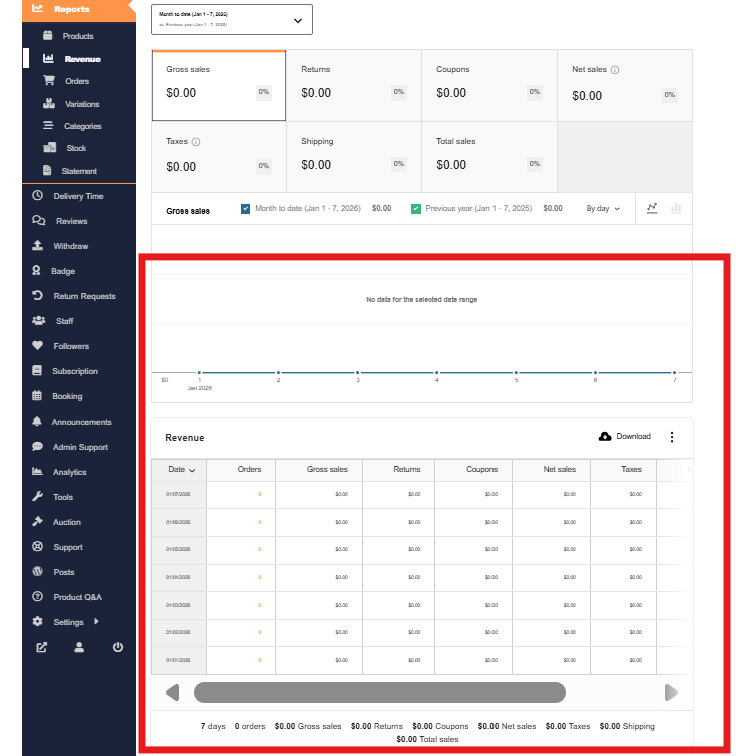
4️⃣ Revenue Report
Path:
Reports → Revenue
What it shows:
Bottom table shows:
Why it’s useful:
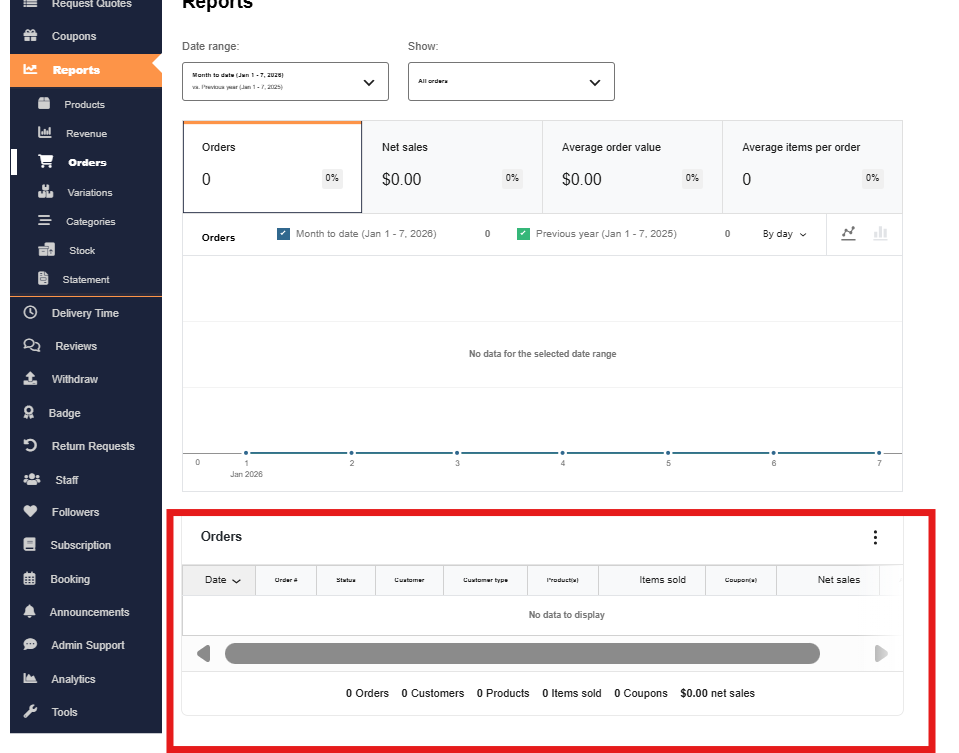
Orders Report
Path:
Reports → Orders
What it shows:
Table includes:
Why it’s useful:
5 – Orders Report
Path:
Reports → Orders
What it shows:
Table includes:
Why it’s useful:
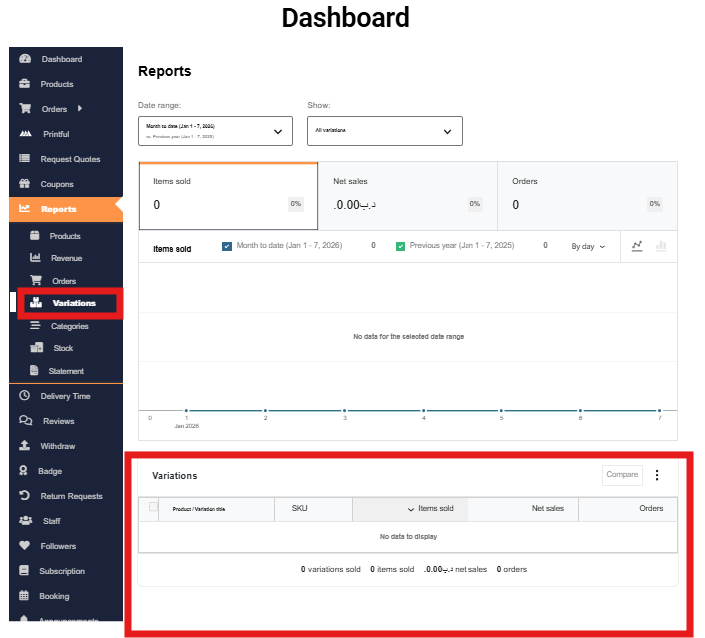
6️- Variations Report
Path:
Reports → Variations
What it shows:
Table includes:
Why it’s useful:
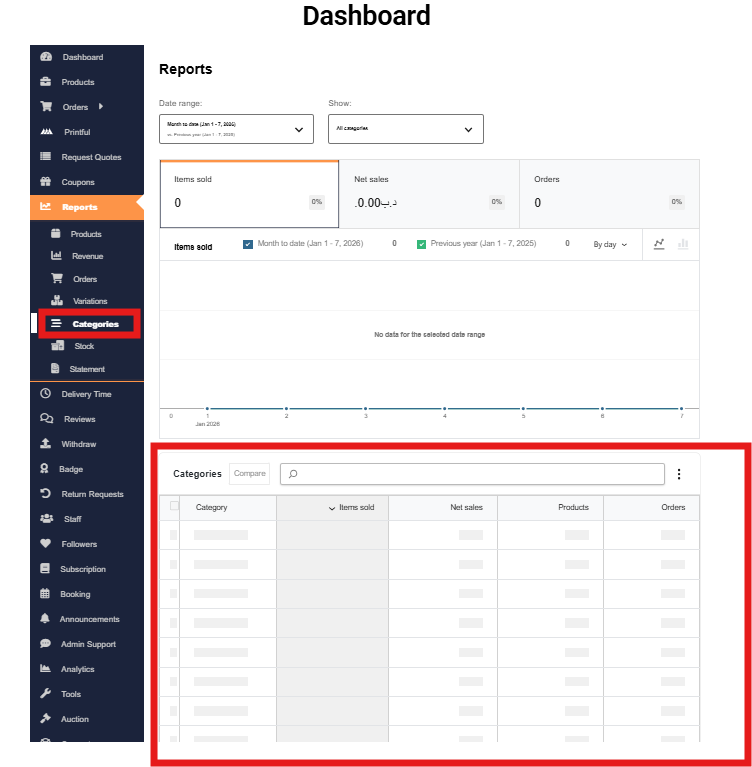
7️- Categories Report
Path:
Reports → Categories
What it shows:
Table includes:
Why it’s useful:
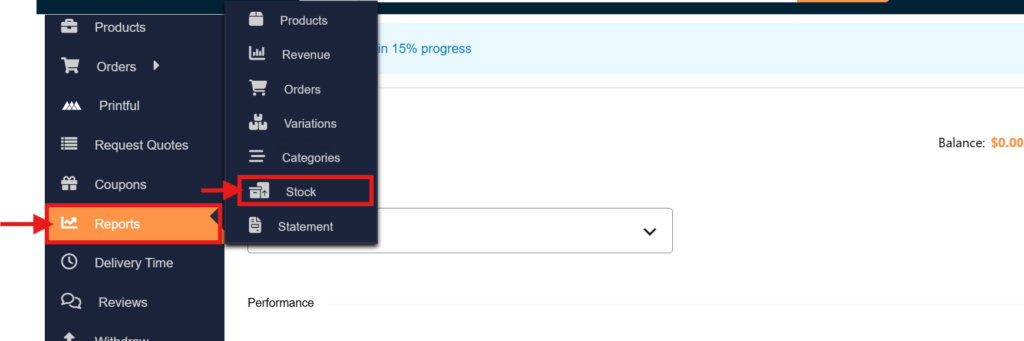
8️- Stock Report
Path:
Reports → Stock
What it shows:
Table includes:
Summary at bottom:
Why it’s useful:
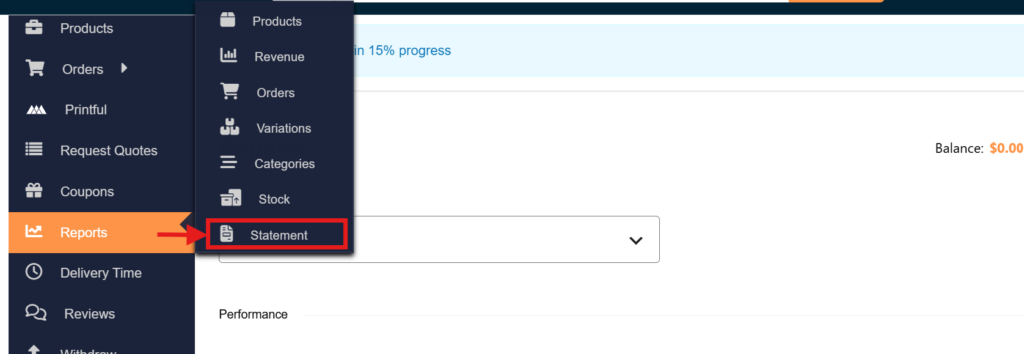
9️- Statement Report (Most Important for Payments)
Path:
Reports → Statement
What it shows:
Table includes:
Extra feature:
Why it’s useful:
Final Notes for Sellers
Join our mailing list for exclusive promotions, new product alerts, and daily savings!
Copy Right © 2023-2025 aladdinstores.com
